Computer Software selected work

Growth Intelligence Platform

Revenue growth platform designed for conversion funnel tracking, campaign analytics, acquisition metrics, and data-driven growth strategies for scaling SaaS businesses.

Growth Intelligence Platform project cover
Sehgal MotorsMay 1, 2022 – Aug 31, 2022

measurable outcomes

Funnel visibility revealed a 68% drop-off between inquiry and showroom visit (the biggest leak). Sales conversion from test drive to purchase varied 3x between locations, identifying coaching opportunities
Attribution data revealed Google Ads generating 4.2x ROI while print advertising generated 0.3x. Marketing budget reallocated: $15K/month shifted from print to digital, generating 28 additional qualified inquiries/month
Average inventory days-on-lot reduced from 45 to 28. Slow-mover identification 3 weeks earlier. Purchasing decisions aligned with actual demand data for the first time
Concrete result: Full growth intelligence operational across 4 locations. Marketing ROI improved 35% through data-driven allocation. Referral program generating 12% of new inquiries. Leadership making weekly data-driven growth decisions

problem

What had to change.

Marketing attribution didn't exist. $40K/month across Google Ads, Facebook, print, and radio with no tracking of which channels drove showroom visits, test drives, or purchases. Budget allocation was based on "we've always done it this way"
Sales funnel was invisible. The business knew how many vehicles were sold but not how many inquiries, test drives, or quotes preceded each sale. Conversion rates at each stage were unknown. Sales team performance was measured only by final sales numbers
Customer acquisition cost was a rough estimate: total marketing spend divided by total sales. No per-channel, per-location, or per-vehicle-category breakdown. The business couldn't tell if a $500 Google Ad spend generated $50K in sales or $0
Inventory-to-demand matching was reactive. Popular models sold out while slow movers sat on the lot for months. No data connecting customer inquiries to inventory decisions. Purchasing was based on manufacturer allocations and dealer intuition
Customer lifetime value was unmeasured. Repeat buyers, service revenue, referrals, and trade-in patterns were not tracked. The business treated every customer as a one-time transaction
Reporting was a monthly PowerPoint compiled by the finance team over 3 days, combining data from the DMS (dealer management system), Google Analytics, and manual sales logs. Numbers were frequently inconsistent between sources

execution

The implementation lanes behind the project.

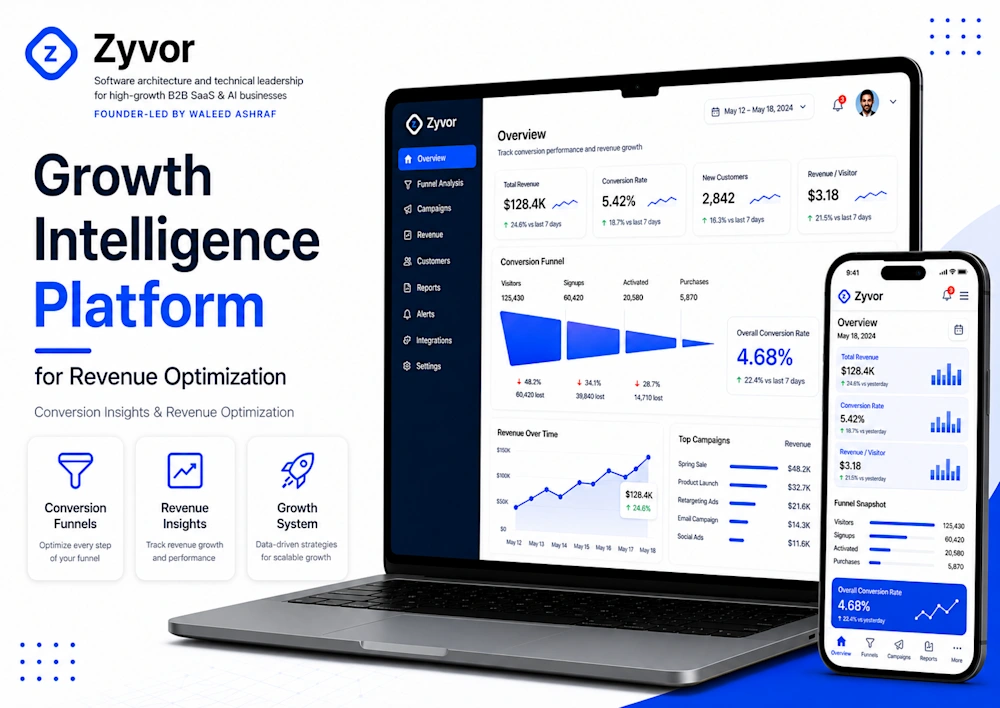
See every step from ad click to vehicle delivery.

Full-Funnel Conversion Tracking

  • End-to-end funnel tracking: website visit → inquiry submission → showroom visit → test drive → quote → negotiation → purchase, with conversion rates and drop-off analysis at each stage
  • Per-location funnel views showing which locations convert better at each stage and where the biggest improvement opportunities exist
  • Sales rep performance dashboards showing individual conversion rates, average deal size, and time-to-close compared to team benchmarks
Funnel visibility revealed a 68% drop-off between inquiry and showroom visit (the biggest leak). Sales conversion from test drive to purchase varied 3x between locations, identifying coaching opportunities

Know exactly which $1 of marketing generates which $1 of revenue.

Marketing Attribution Engine

  • Multi-touch attribution tracking customer interactions across Google Ads, Facebook, website, phone calls, and showroom visits with configurable attribution models (first-touch, last-touch, linear, time-decay)
  • Channel ROI dashboard showing cost per inquiry, cost per test drive, cost per sale, and revenue per dollar spent for each marketing channel
  • Campaign-level performance tracking with A/B test support for ad creative, landing pages, and promotional offers
Attribution data revealed Google Ads generating 4.2x ROI while print advertising generated 0.3x. Marketing budget reallocated: $15K/month shifted from print to digital, generating 28 additional qualified inquiries/month

Stock what sells. Move what doesn't.

Inventory Intelligence

  • Demand signals dashboard connecting customer inquiries, search trends, and test drive requests to specific vehicle models and configurations
  • Aging inventory alerts with automatic price adjustment recommendations for vehicles sitting beyond configurable thresholds
  • Predictive demand modeling using historical sales patterns, seasonal trends, and current inquiry volume to recommend purchasing decisions
Average inventory days-on-lot reduced from 45 to 28. Slow-mover identification 3 weeks earlier. Purchasing decisions aligned with actual demand data for the first time

Every customer is worth more than their first purchase.

Customer Lifetime Value Tracking

  • Customer profiles tracking purchase history, service visits, referrals, trade-ins, and total lifetime revenue
  • Repeat buyer identification with automated re-engagement campaigns triggered at optimal intervals based on vehicle age and service history
  • Referral tracking attributing new customers to existing customer recommendations with referral program management
Average customer lifetime value calculated at 2.8x initial purchase value (including service, accessories, and repeat purchases). Referral program launched, generating 12% of new inquiries within 3 months

Every growth metric. Live. Across all locations.

Real-Time Growth Dashboard

  • Executive dashboard showing revenue, funnel metrics, marketing ROI, inventory health, and customer acquisition cost updated in real time across all 4 locations
  • Automated weekly growth reports with trend analysis, anomaly detection, and recommended actions
  • Goal tracking with progress visualization: monthly revenue targets, conversion rate goals, and marketing efficiency benchmarks with real-time progress indicators
Monthly PowerPoint reporting eliminated. Leadership making weekly growth decisions with current data. Goal tracking creating accountability across sales and marketing teams

Make the implementation usable after launch.

Architecture Handoff and Operating Model

  • Documented the key architecture decisions, tradeoffs, and ownership boundaries behind the work.
  • Connected delivery lanes to support, operations, and future product iteration instead of treating launch as the finish line.
  • Gave the team a clearer operating model for scaling the product without recreating the same bottlenecks.
Full growth intelligence operational across 4 locations. Marketing ROI improved 35% through data-driven allocation. Referral program generating 12% of new inquiries. Leadership making weekly data-driven growth decisions

project depth

More context behind the Growth Intelligence Platform work.

Each selected project is read through business pressure, architecture tradeoffs, delivery sequencing, team operating model, role coverage, and stack fit so the case study stays useful for founders, CTOs, and product leaders evaluating similar work.

business pressure

Why the work mattered

The business was spending $480K/year on marketing with no idea what was working. Growth was happening by accident, not by design. The project started from a real operational constraint, not a decorative rebuild, which made the architecture work accountable to business movement.

architecture pressure

PostgreSQL with materialized views for funnel analytics

Funnel calculations require multi-stage aggregations across large event tables. Materialized views pre-compute conversion rates per stage, location, and time period. Dashboard queries return in under 200ms regardless of date range

implementation priority

Full-Funnel Conversion Tracking

Funnel visibility revealed a 68% drop-off between inquiry and showroom visit (the biggest leak). Sales conversion from test drive to purchase varied 3x between locations, identifying coaching opportunities

operating change

What changed for the team

Funnel visibility revealed a 68% drop-off between inquiry and showroom visit (the biggest leak). Sales conversion from test drive to purchase varied 3x between locations, identifying coaching opportunities

role coverage

Leadership and engineering coverage

The work called for software architect, technical lead, software consultant, technical strategy, full-stack engineer coverage, connecting strategy, implementation, and delivery quality instead of treating them as separate tracks.

stack fit

Technology choices in context

AWS, Next.js, PostgreSQL, React, Node.js, TypeScript were part of the delivery context, but the value came from how the stack supported maintainability, scalability, and a stronger path from architecture to production.

architecture decisions

Technical choices that mattered.

PostgreSQL with materialized views for funnel analytics

Funnel calculations require multi-stage aggregations across large event tables. Materialized views pre-compute conversion rates per stage, location, and time period. Dashboard queries return in under 200ms regardless of date range

React for interactive funnel visualizations

Funnel analysis requires interactive drill-down: click a stage to see drop-off reasons, click a location to compare performance, click a time period to see trends. React's component model handles complex interactive visualizations with smooth state management

AWS with multi-location data aggregation

4 locations with separate DMS systems. ETL pipelines pull data from each location's system nightly, normalize it into a unified schema, and load it into the analytics database. Cross-location queries run against the unified dataset

UTM parameter tracking with server-side session stitching

Marketing attribution requires connecting anonymous website visits to identified showroom visitors. Server-side session stitching links UTM-tagged web sessions to CRM records when the visitor identifies themselves (form submission, phone call, showroom check-in)

operating model

Architecture changes were tied directly to how the software business would operate after launch.

Funnel visibility revealed a 68% drop-off between inquiry and showroom visit (the biggest leak). Sales conversion from test drive to purchase varied 3x between locations, identifying coaching opportunities
Attribution data revealed Google Ads generating 4.2x ROI while print advertising generated 0.3x. Marketing budget reallocated: $15K/month shifted from print to digital, generating 28 additional qualified inquiries/month
Full growth intelligence operational across 4 locations. Marketing ROI improved 35% through data-driven allocation. Referral program generating 12% of new inquiries. Leadership making weekly data-driven growth decisions

results

What changed after the work.

Funnel visibility revealed a 68% drop-off between inquiry and showroom visit (the biggest leak). Sales conversion from test drive to purchase varied 3x between locations, identifying coaching opportunities
Attribution data revealed Google Ads generating 4.2x ROI while print advertising generated 0.3x. Marketing budget reallocated: $15K/month shifted from print to digital, generating 28 additional qualified inquiries/month
Average inventory days-on-lot reduced from 45 to 28. Slow-mover identification 3 weeks earlier. Purchasing decisions aligned with actual demand data for the first time

Week 1

Funnel tracking deployed across all 4 locations. First conversion data revealing 68% inquiry-to-showroom drop-off. Sales rep performance dashboards live

Week 3

Marketing attribution engine active. Google Ads ROI at 4.2x, print at 0.3x. Budget reallocation recommendation delivered to marketing team

Month 1

Inventory intelligence identifying slow movers 3 weeks earlier. Customer lifetime value tracking revealing 2.8x multiplier. Real-time growth dashboard replacing monthly PowerPoint

Month 2

Marketing budget reallocated: $15K/month from print to digital. 28 additional qualified inquiries/month. Inventory days-on-lot dropping from 45 toward 28

Month 4

Full growth intelligence operational across 4 locations. Marketing ROI improved 35% through data-driven allocation. Referral program generating 12% of new inquiries. Leadership making weekly data-driven growth decisions

Final outcome

Full growth intelligence operational across 4 locations. Marketing ROI improved 35% through data-driven allocation. Referral program generating 12% of new inquiries. Leadership making weekly data-driven growth decisions

buyer relevance

Why this project belongs in Zyvor software architecture work.

Software architecture signal

Growth Intelligence Platform shows how architecture decisions can move from implementation detail into business leverage for computer software teams.

Technical leadership signal

The work connects software architect, technical lead, software consultant responsibilities with delivery clarity, execution confidence, and a cleaner operating model.

Scale-readiness signal

Full growth intelligence operational across 4 locations. Marketing ROI improved 35% through data-driven allocation. Referral program generating 12% of new inquiries. Leadership making weekly data-driven growth decisions

What kind of business is Growth Intelligence Platform most relevant for?

This project is most relevant for computer software and computer software teams that need stronger software architecture, clearer technical direction, and more reliable execution as product or operational complexity increases.

What did Zyvor focus on in this selected work?

I built a growth intelligence platform that tracks the complete customer journey from first ad click to purchase (and beyond), attributes revenue to marketing channels, measures sales funnel conversion, and provides real-time dashboards for data-driven growth decisions. The work was framed around practical architecture decisions, delivery ownership, and measurable business outcomes rather than advisory language alone.

How does this support Zyvor's software architecture consulting focus?

Growth Intelligence Platform supports Zyvor's focus on B2B SaaS and AI software architecture consulting by connecting system design, technical leadership, scalability, and execution quality to a concrete project outcome: Full growth intelligence operational across 4 locations. Marketing ROI improved 35% through data-driven allocation. Referral program generating 12% of new inquiries. Leadership making weekly data-driven growth decisions

What kind of technical leadership problem does this represent?

It represents the point where delivery pressure, architecture ownership, and business expectations start converging. In work like Growth Intelligence Platform, technical leadership is not only about writing code; it is about choosing the right sequence, reducing ambiguity, and giving the team a clearer execution model.

What should a founder or CTO notice in this project?

A founder or CTO should notice the link between the business problem and the technical system underneath it. The most important signal is not a tool choice by itself; it is how the architecture, implementation lanes, and operating model support a measurable business result.

Does this kind of work require a full rebuild?

Not always. The right engagement depends on where the risk sits. Some projects need a focused architecture reset, some need modernization, and some need new product development. Zyvor frames the work around the smallest practical path to stronger scalability, reliability, and delivery confidence.

Decision context

The business was spending $480K/year on marketing with no idea what was working. Growth was happening by accident, not by design. That business pressure shaped the architecture choices, implementation order, and operating model behind the work.

Delivery leverage

Funnel visibility revealed a 68% drop-off between inquiry and showroom visit (the biggest leak). Sales conversion from test drive to purchase varied 3x between locations, identifying coaching opportunities This is the kind of delivery leverage Zyvor looks for: fewer bottlenecks, clearer ownership, and better execution rhythm.

Architecture handoff

The project covered AWS, Next.js, PostgreSQL, React, Node.js while keeping the handoff focused on maintainability, future change, and leadership clarity instead of isolated implementation tasks.

Best-fit conversation

A similar engagement usually starts with the current bottleneck, the architecture decision that feels stuck, and the business risk that is becoming harder to ignore.