engagement depth
More than a project screenshot: what the work proves.
The value of selected work is strongest when it shows the connection between architecture choices, business pressure, implementation quality, and leadership confidence.
Architecture decisions connected to commercial or operational pressure
Technical leadership that clarifies ownership and sequencing
Implementation work shaped around measurable delivery outcomes
Scalable execution patterns that remain useful after launch
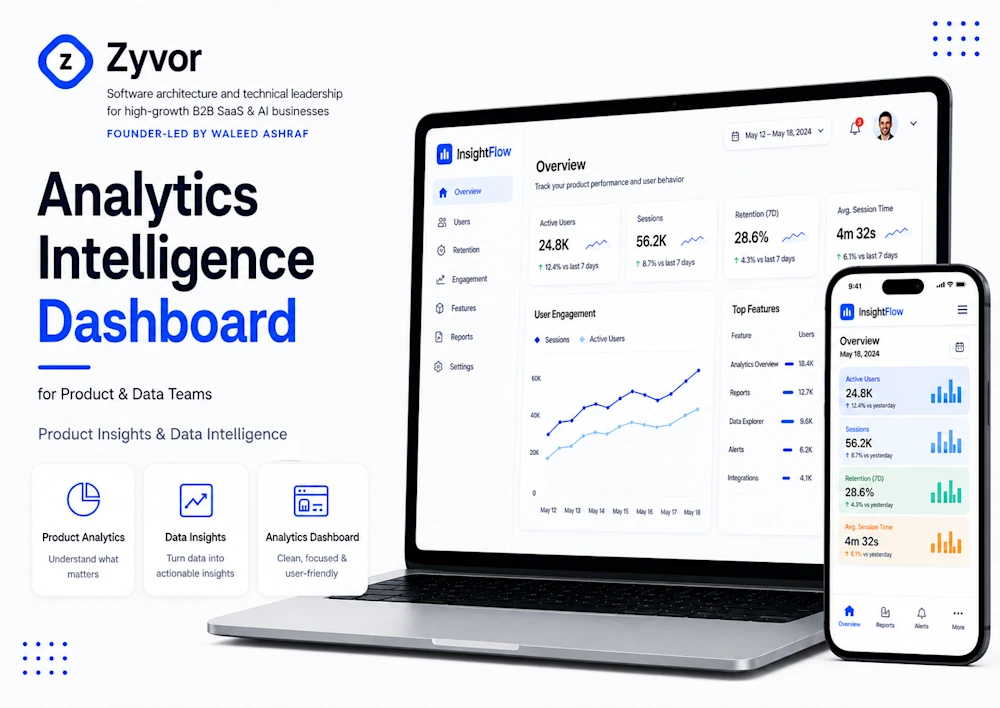
Decision context
The product team was flying blind. Every feature decision was a bet with no way to measure the outcome. That business pressure shaped the architecture choices, implementation order, and operating model behind the work.
Delivery leverage
Full product instrumentation deployed in 2 weeks. 150+ distinct events tracked across all product surfaces. Event ingestion handling 2M+ events/day with sub-100ms capture latency This is the kind of delivery leverage Zyvor looks for: fewer bottlenecks, clearer ownership, and better execution rhythm.
Architecture handoff
The project covered AWS, Next.js, PostgreSQL, TypeScript, React while keeping the handoff focused on maintainability, future change, and leadership clarity instead of isolated implementation tasks.
Best-fit conversation
A similar engagement usually starts with the current bottleneck, the architecture decision that feels stuck, and the business risk that is becoming harder to ignore.